Exit Opportunity Predictions
Using data from Crunchbase to predict startup exit events
For the past couple of weeks, I have been working on developing a classification model that uses levels of funding in a startup to predict whether or not a VC investing in the company will have an opportunity to cash out of the company. To build my model, I used free data from Crunchbase, which is unfortunately fairly limited. As you can imagine, there aren’t any publicly available databases for historical startup funding rounds, and Crunchbase only offers data for startup funding through 2013 for free. That being said, by using a Random Forest classification model, I was able to gain some interesting insights into the types of factors that increase the probability that a startup will present an exit event for a VC to capitalize on. I classified an exit opportunity as a company that was either acquired or went to an IPO.
Cleaning the Data
The free data offered by Crunchbase is provided in 11 different SQL files that include MySQL scripts and tables written out explicitly for creation. I originally tried to load these tables using Postgres, but the slightly different syntax in MySQL meant that I had to go through the process of creating my own local MySQL database. Once I had this database up and running, I loaded in each of the 11 SQL files, and used the pymysql package to read each of the tables into Python. These tables included a variety of information on each of the startups in the dataset, the investors in each funding round, and details on each of those investors. I used the merge functionality in Pandas to join each of these tables in order to eliminate companies that did not have any valid investors in the dataset. This series of merges left me a dataframe with many unnecessary columns, so at this point I reviewed each of the columns individually and eliminated those that were unnecessary to my model. This cleaning of the model left me with a dataframe with data about historical funding rounds, the companies being funded, and the firms that were doing the funding. To shape this into a manageable format for model creation, I had to organize the data by company into multiple columns. To do this, I looped through all instances of funding for companies across different funding rounds, and created a new column for each different possible round, even if a given company had no funding for a given round. All of this cleaning left me with a data frame that could easily be analyzed using one of the many SKLearn classification models.
Creating the Model
With this data now in a manageable format, I began testing different models. I decided that perfect interpretability was not of the utmost concern, given that I would be creating a dashboard in order to demonstrate my results, so I focused on maximizing the F1 score of my model. I chose F1 because I thought it would be important to maximize both the precision (the ratio of accurate ‘Exit’ predictions to all ‘Exit’ predictions) as well as the recall (the ratio of accurate ‘Exit’ predictions to the total number of ‘Exited’ startups in my sample) of the model. These are both important in this specific problem because, from the perspective of a VC, a user would want to pick as many startups that presented exit opportunities as possible without incorrectly funding startups without exit opportunities. I next ran Random Forest (tested at different maximum depths), Logistic Regression, K-Nearest Neighbors (tested with different values of K), and Naive Bayes models, compared their F1 scores.
F1 Scores by Model
| Model | F1 Score |
|---|---|
| Random Forest (Max Depth=15) | 0.4615 |
| Logistic Regression | 0.4072 |
| KNN (K=1) | 0.3019 |
| Naive Bayes | 0.3463 |
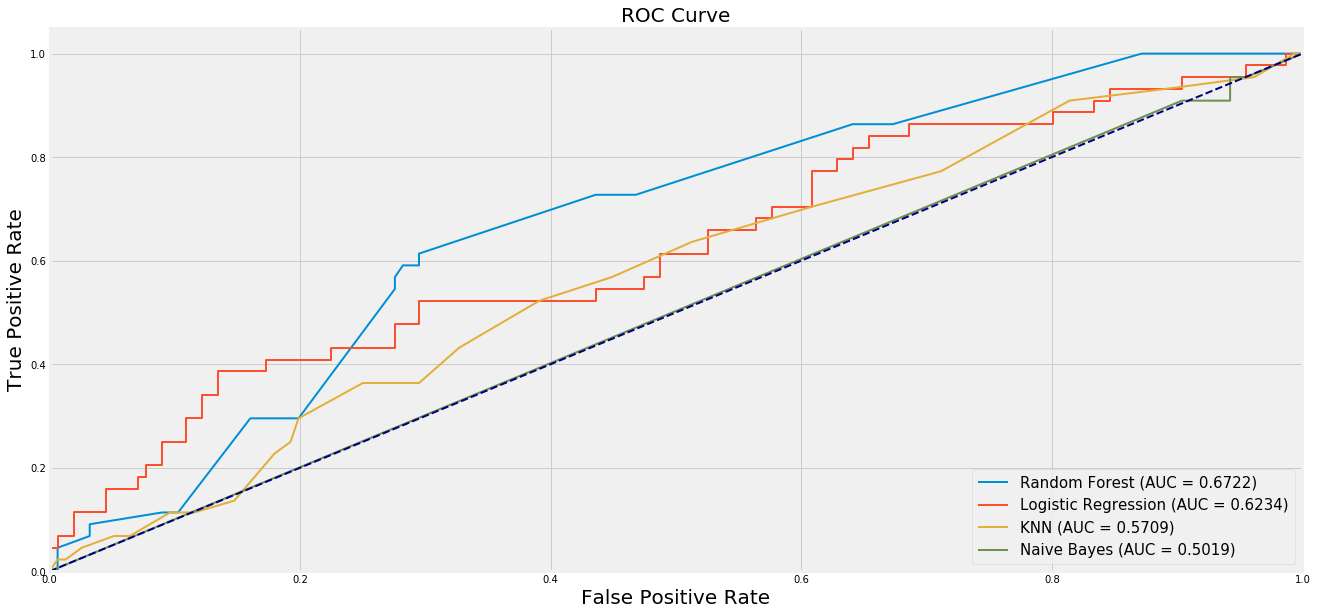
To further cement this decision, I also analyzed the ROC curves of each of these models. The ROC curve helps to explain the efficacy of the model by comparing the sensitivity (true positive rate) to the specificity (false positive rate) across different thresholds for acceptance. A high value for the area under the curve (AUC) of a given model corresponds to a model with a better ratio of sensitivity to specificity across all thresholds. Random Forest was again the best model from my sample by AUC.
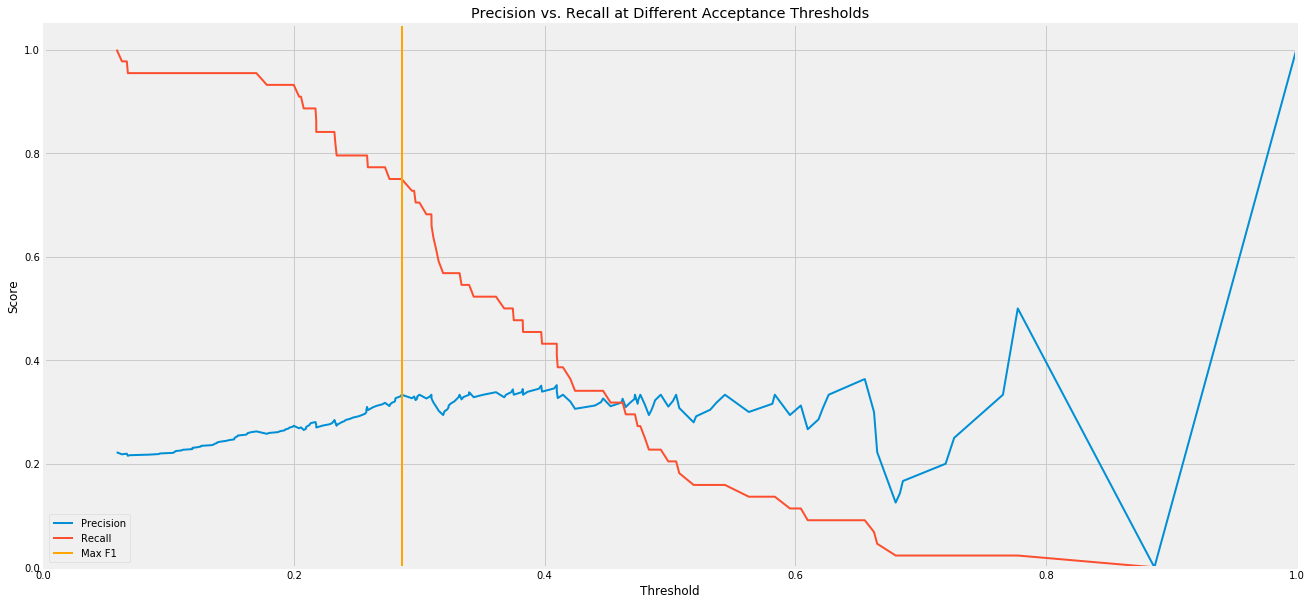
Having decided on using a Random Forest model for my classifier, I started to analyze the model more in order to optimize its performance. I started by analyzing the precision vs. recall of the model at different thresholds, and found a threshold of 0.2858 to be optimal for my F1 score.
In addition, I found that the most important features in my model were the number of milestones met, the total funding, and the size of the largest investor. On the other hand, amount of angel investing and crowdfunding were found to have little impact on the exit probability. I reviewed some of the results from my test sample, and found that some notable companies such as Twitter and Spotify were correctly predicted as presenting a high exit probability.
Creating the dashboard
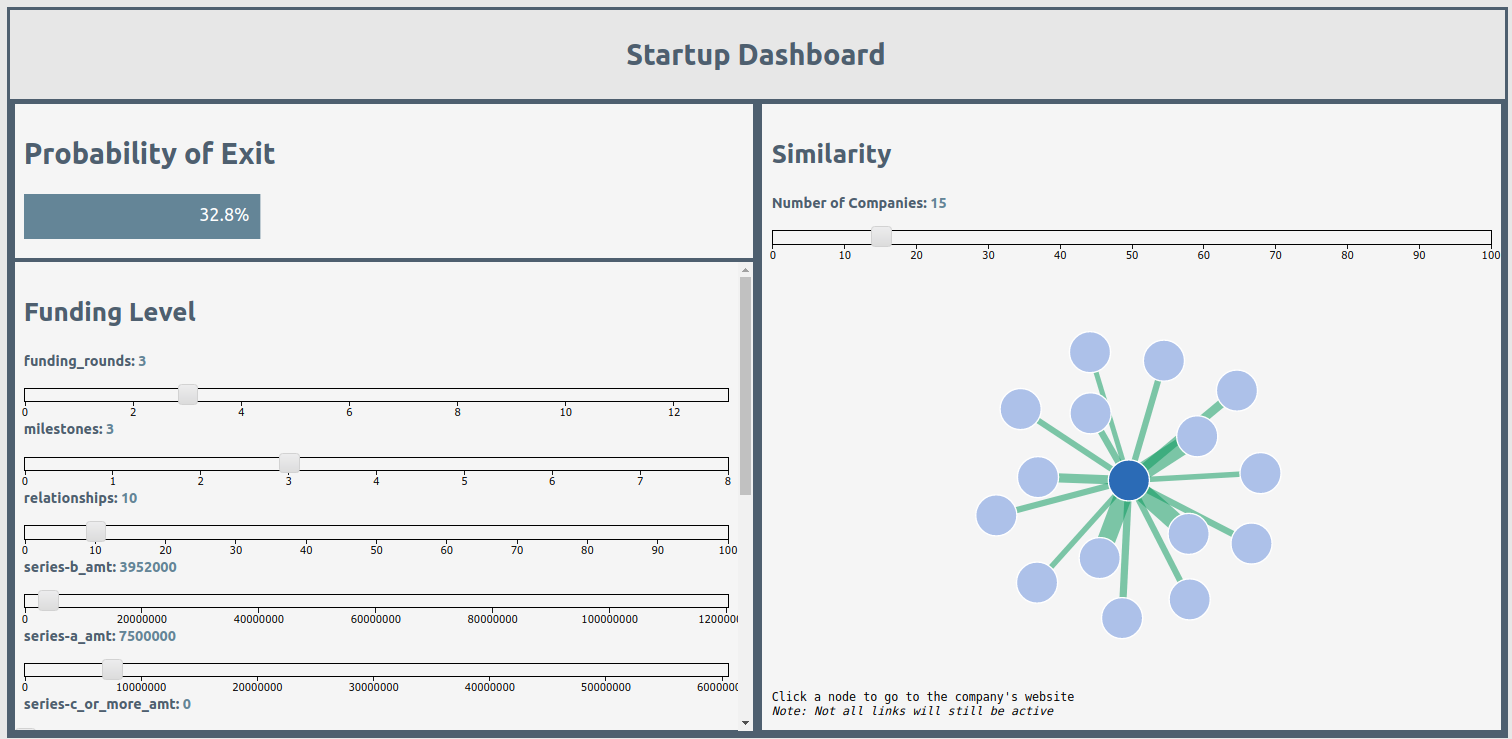
Once I had an accurate model to use, I created a dashboard using Flask and D3 to allow for interpretable results. The dashboard allowed a user to vary the different features of the model (such as size of funding rounds and number of milestones met) in order to see the probability of exit based on the selection. Changing the features also created a similarity graph on the dashboard of startups from the sample with similar attributes. These nodes were all clickable, taking a user to the homepage for the company represented by the node so they could better explore these relationships. D3 was used to create the sliders for the feature selection, display the modeled probabilities, and generate the nodes (using a force directed graph).
Takeaways
Overall, this was a great project to see how data science could be applied to a financial problem. Having something in place to help VCs make funding decisions could be incredibly useful. Estimates vary on VC success rates, but some put it as low as 25%, and using my model could help boost that probability to maximize profits and ensure that the proper companies are being funded. With the data as limited as it was, this model certainly has some room for improvement. In particular, I would like to see more information on valuations at each funding round, as well as user counts and balance sheet items like revenue. If my model was accurate to this degree with this data, I would think that layering in this additional insight could make it usable to VCs of all sizes. Hopefully I can one day have access to the more detailed Pitchbook data in order to improve this model, but as it stands right now, I’m happy to have learned so much about classification with Python and building an app with D3 and HTML/CSS.